
When examined over long stretches, the stock market can’t be beat. While other asset classes have produced solid nominal gains for investors, including gold, oil, housing, and Treasury bonds, none have come close to matching the annualized average returns that stocks have brought to the table over the last century.
But when the lens is narrowed to just a few years or an even shorter timeline, predicting the directional moves of the ageless Dow Jones Industrial Average (DJINDICES: ^DJI), benchmark S&P 500 (SNPINDEX: ^GSPC), and growth-powered Nasdaq Composite (NASDAQINDEX: ^IXIC) with any sustained accuracy becomes practically impossible.

However, this doesn’t stop investors from trying to do the impossible. Though there’s no economic data point or indicator that can concretely predict which direction the Dow, S&P 500, and Nasdaq Composite will head next, there are a very select group of metrics and forecasting tools that have strongly correlated with moves higher and lower in the major stock indexes throughout history.
One of these metrics, which appears to be foreshadowing a massive move in stocks, is U.S. money supply.
U.S. money supply hasn’t done this in nine decades
Among the five measures of money supply, M1 and M2 tend to garner most of the focus from economists and the investing community. M1 is a measure of cash and coins in circulation, as well as demand deposits in a checking account. It’s money you have easy access to that can be spent immediately.
On the other hand, M2 money supply accounts for everything in M1 and also adds in savings accounts, money market accounts, and certificates of deposit (CDs) below $100,000. This is still money you can access, but you’ll have to work a bit harder to get to it. This is also the money supply metric that’s raising eyebrows right now for all the wrong reasons.
Most economists and investors tend to pay very little attention to M2 money supply because it’s grown with such consistency over time. Since the U.S. economy expands over long periods, it’s only natural that more cash and coins are needed to complete transactions.
But in those extremely rare instances where a notable contraction in M2 money supply has been observed, trouble has historically followed for the U.S. economy and stock market.
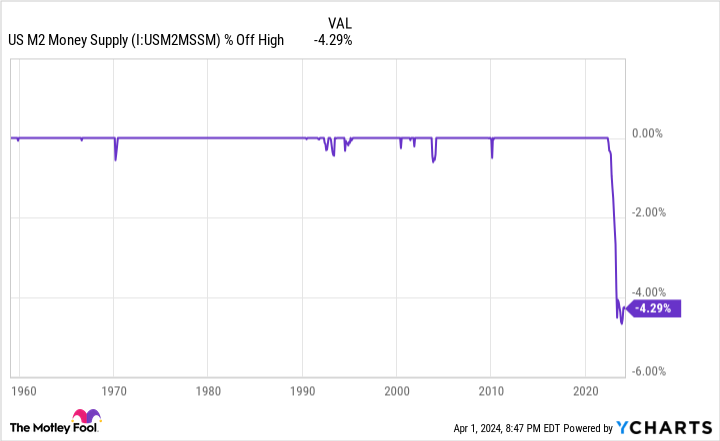
Two years ago, in March 2022, M2 money supply reached approximately $21.71 trillion. Based on the latest monthly data release from the Board of Governors of the Federal Reserve System, M2 clocked in at $20.78 trillion in February 2024. As you can see in the chart above, this represents a relatively minor 0.5% year-over-year decline, but a more pronounced 4.29% drop-off since March 2022. It’s also the first meaningful move lower anyone has witnessed in M2 since the Great Depression.
In one respect, this 4.29% retracement in U.S. money supply may simply be a reversion to the mean after M2 expanded by a historic 26% on a year-over-year basis during the height of the COVID-19 pandemic. Multiple rounds of fiscal stimulus flooded the U.S. economy with cash and consumers who were more than willing to spend it.
On the other hand, more than 150 years’ worth of history has been pretty clear about what happens when M2 money supply retraces by more than 2% from a record high.
Last year, Reventure Consulting CEO Nick Gerli shared the post you see below on X (the platform formerly known as Twitter). Gerli leaned on data from the U.S. Census Bureau and Federal Reserve to track M2 movements since 1870.
WARNING: the Money Supply is officially contracting. 📉
This has only happened 4 previous times in last 150 years.
Each time a Depression with double-digit unemployment rates followed. 😬 pic.twitter.com/j3FE532oac
— Nick Gerli (@nickgerli1) March 8, 2023
Gerli noted five instances where M2 money supply declined by at least 2% on a year-over-year basis, including the significant year-over-year move lower observed in 2023. The previous four instances where M2 fell by at least 2% — 1878, 1893, 1921, and 1931-1933 — were associated with periods of depression and high unemployment for the U.S. economy.
To evaluate this data agnostically, it must be noted that the nation’s central bank didn’t exist in 1878 or 1893. Further, monetary and fiscal policy have come a long way since the Great Depression. The probability of a depression occurring today given the wealth of fiscal and monetary tools available is low.
But this data set is pretty clear: If the amount of cash accessible to consumers is declining, and the prevailing/core rate of inflation is at or above historic norms, there’s a good chance consumers will pare back discretionary purchases. In short, it’s a historic blueprint for a U.S. recession.
Even though stocks don’t move in lockstep with the health of the U.S. economy, a recession would be expected to adversely impact corporate earnings. History shows that the lion’s share of drawdowns in the S&P 500 have occurred after an official recession has been declared.

Patience and perspective are money-in-the-bank attributes for investors
Considering how resilient the U.S. economy has been in the face of rapidly rising interest rates, the prospect of the Dow Jones, S&P 500, and Nasdaq Composite being knocked off of their respective pedestals may not be something you want to hear or talk about. Thankfully, history is a two-way street that very much favors investors who can take a step back and appreciate the power of perspective.
As an example, let’s take a closer look at the course most economic cycles have taken. Although recessions are perfectly normal and inevitable, they’ve historically come and gone in the blink of an eye. Since the end of World War II in September 1945, only three of 12 U.S. recessions lasted at least 12 months. Further, none of the remaining three surpassed 18 months.
With few exceptions, expansions have endured multiple years. In fact, two periods of growth since the mid-1940s hurdled the 10-year mark. While recessions may be unwelcome in the short run, they’ve given way to long-lasting periods of economic and corporate growth.
It’s much the same story when it comes to Wall Street. Data from market research company Yardeni Research shows there have been 40 separate double-digit percentage declines in the S&P 500 since the start of 1950. Even though we’re never going to precisely know ahead of time when these downturns will start, how long they’ll last, or how steep the decline will be, history shows that the S&P 500, Dow, and Nasdaq Composite eventually recoup their losses and push to new highs.
In June 2023, market insights company Bespoke Investment Group took things one step further and published data on just how disproportionate bull markets have been, relative to bear markets, in the S&P 500.
The researchers at Bespoke examined nearly 94 years’ worth of bear and bull markets in the S&P 500, beginning with the start of the Great Depression in September 1929. While the 27 bear markets were noted as lasting an average of 286 calendar days (about 9.5 months), the 27 bull markets in the S&P 500 stuck around for an average of 1,011 calendar days (roughly two years and nine months), or 3.5 times as long.
To add to the above, the longest bear market in the S&P 500’s history was just 630 calendar days (Jan. 11, 1973 – Oct. 3, 1974), by Bespoke’s measure. Comparatively, 13 of the 27 S&P 500 bull markets were longer than the lengthiest bear market.
No matter how unpredictable things may seem in the short term, or how dire a picture historically accurate money-based metrics may paint, time is the undisputed ally of investors. If you have a long-term investment horizon and trust in the undeniable expansion of the U.S. economy over time, even a historic move lower in M2 money supply is nothing to worry about.
Where to invest $1,000 right now
When our analyst team has a stock tip, it can pay to listen. After all, the newsletter they have run for over a decade, Motley Fool Stock Advisor, has nearly tripled the market.*
They just revealed what they believe are the 10 best stocks for investors to buy right now…
*Stock Advisor returns as of April 4, 2024
Sean Williams has no position in any of the stocks mentioned. The Motley Fool has no position in any of the stocks mentioned. The Motley Fool has a disclosure policy.
U.S. Money Supply Is Doing Something No One Has Witnessed Since the Great Depression, and It Foreshadows a Big Move to Come in Stocks was originally published by The Motley Fool